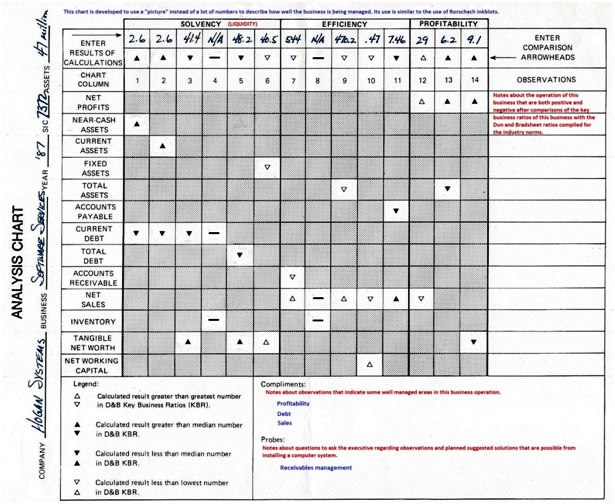
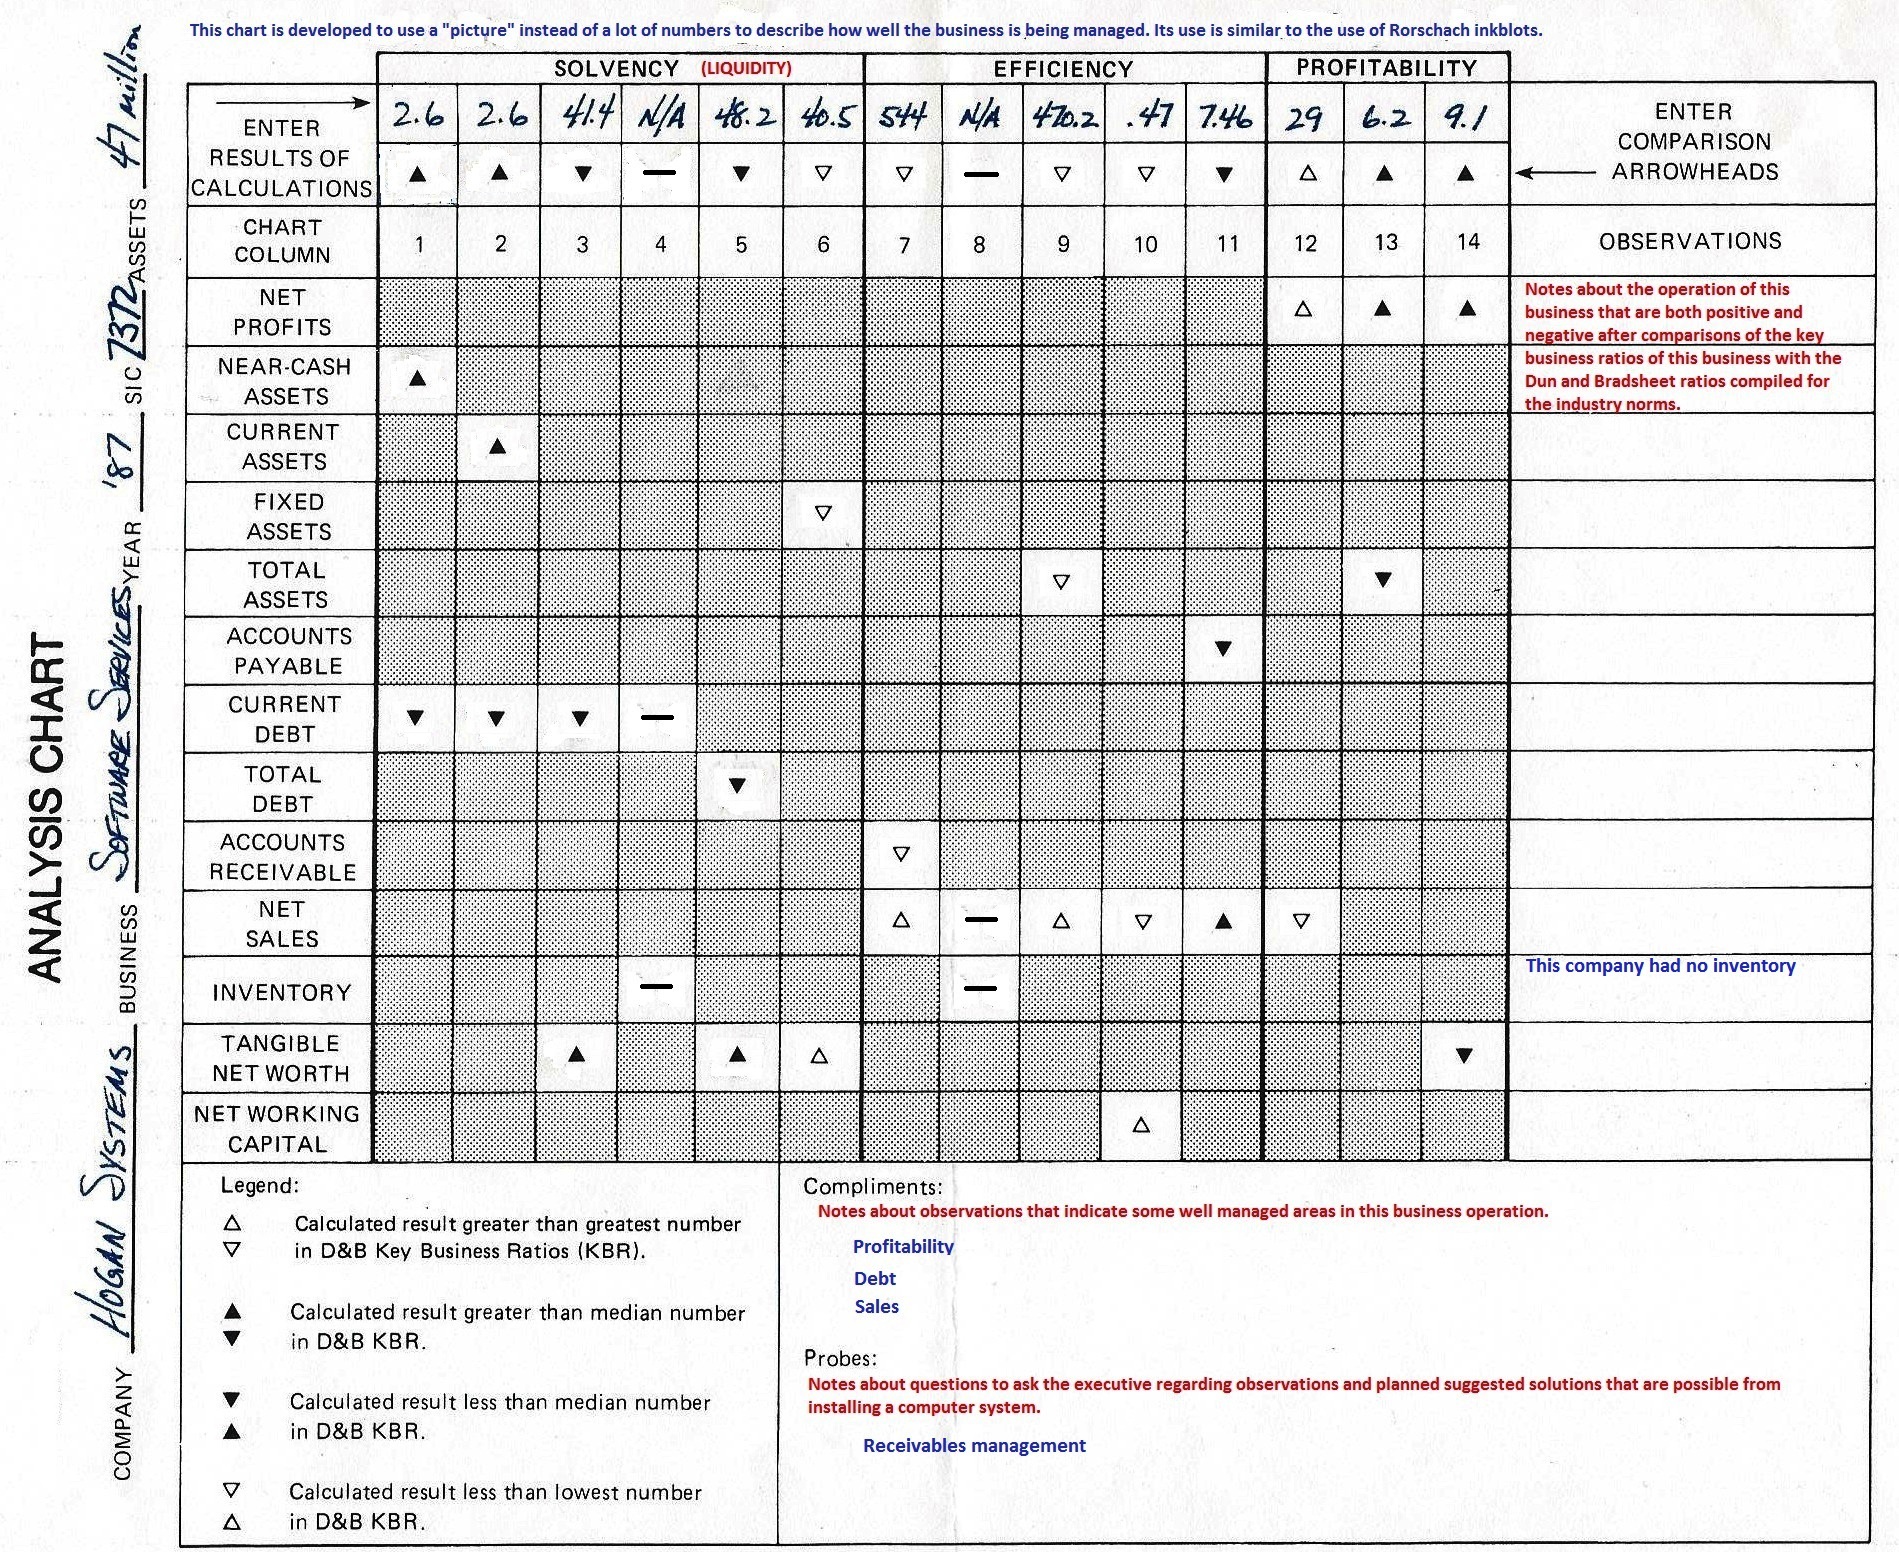
In the bottom right of the second form (shown above) reps were taught what kind of compliments to use and what questions (aka probes) to ask that might lead to the sale of a computer system. These were related to optional remedies for any business weaknesses revealed by the ratios. The financial analysis of a company’s balance sheet and the income statement could often reveal poor management of receivables, an excessive inventory, or an excessive debt situation. If one of these areas was being managed well, a compliment was proper. If any of these areas were not better than the norms for their industry, a question might be asked and a solution suggested. The possible solution notes would be listed in the observations column on the right side of form two.
The purpose of such a visit with an executive was to get permission from the executive to work with his employees to improve the situation with the use of a computer system.
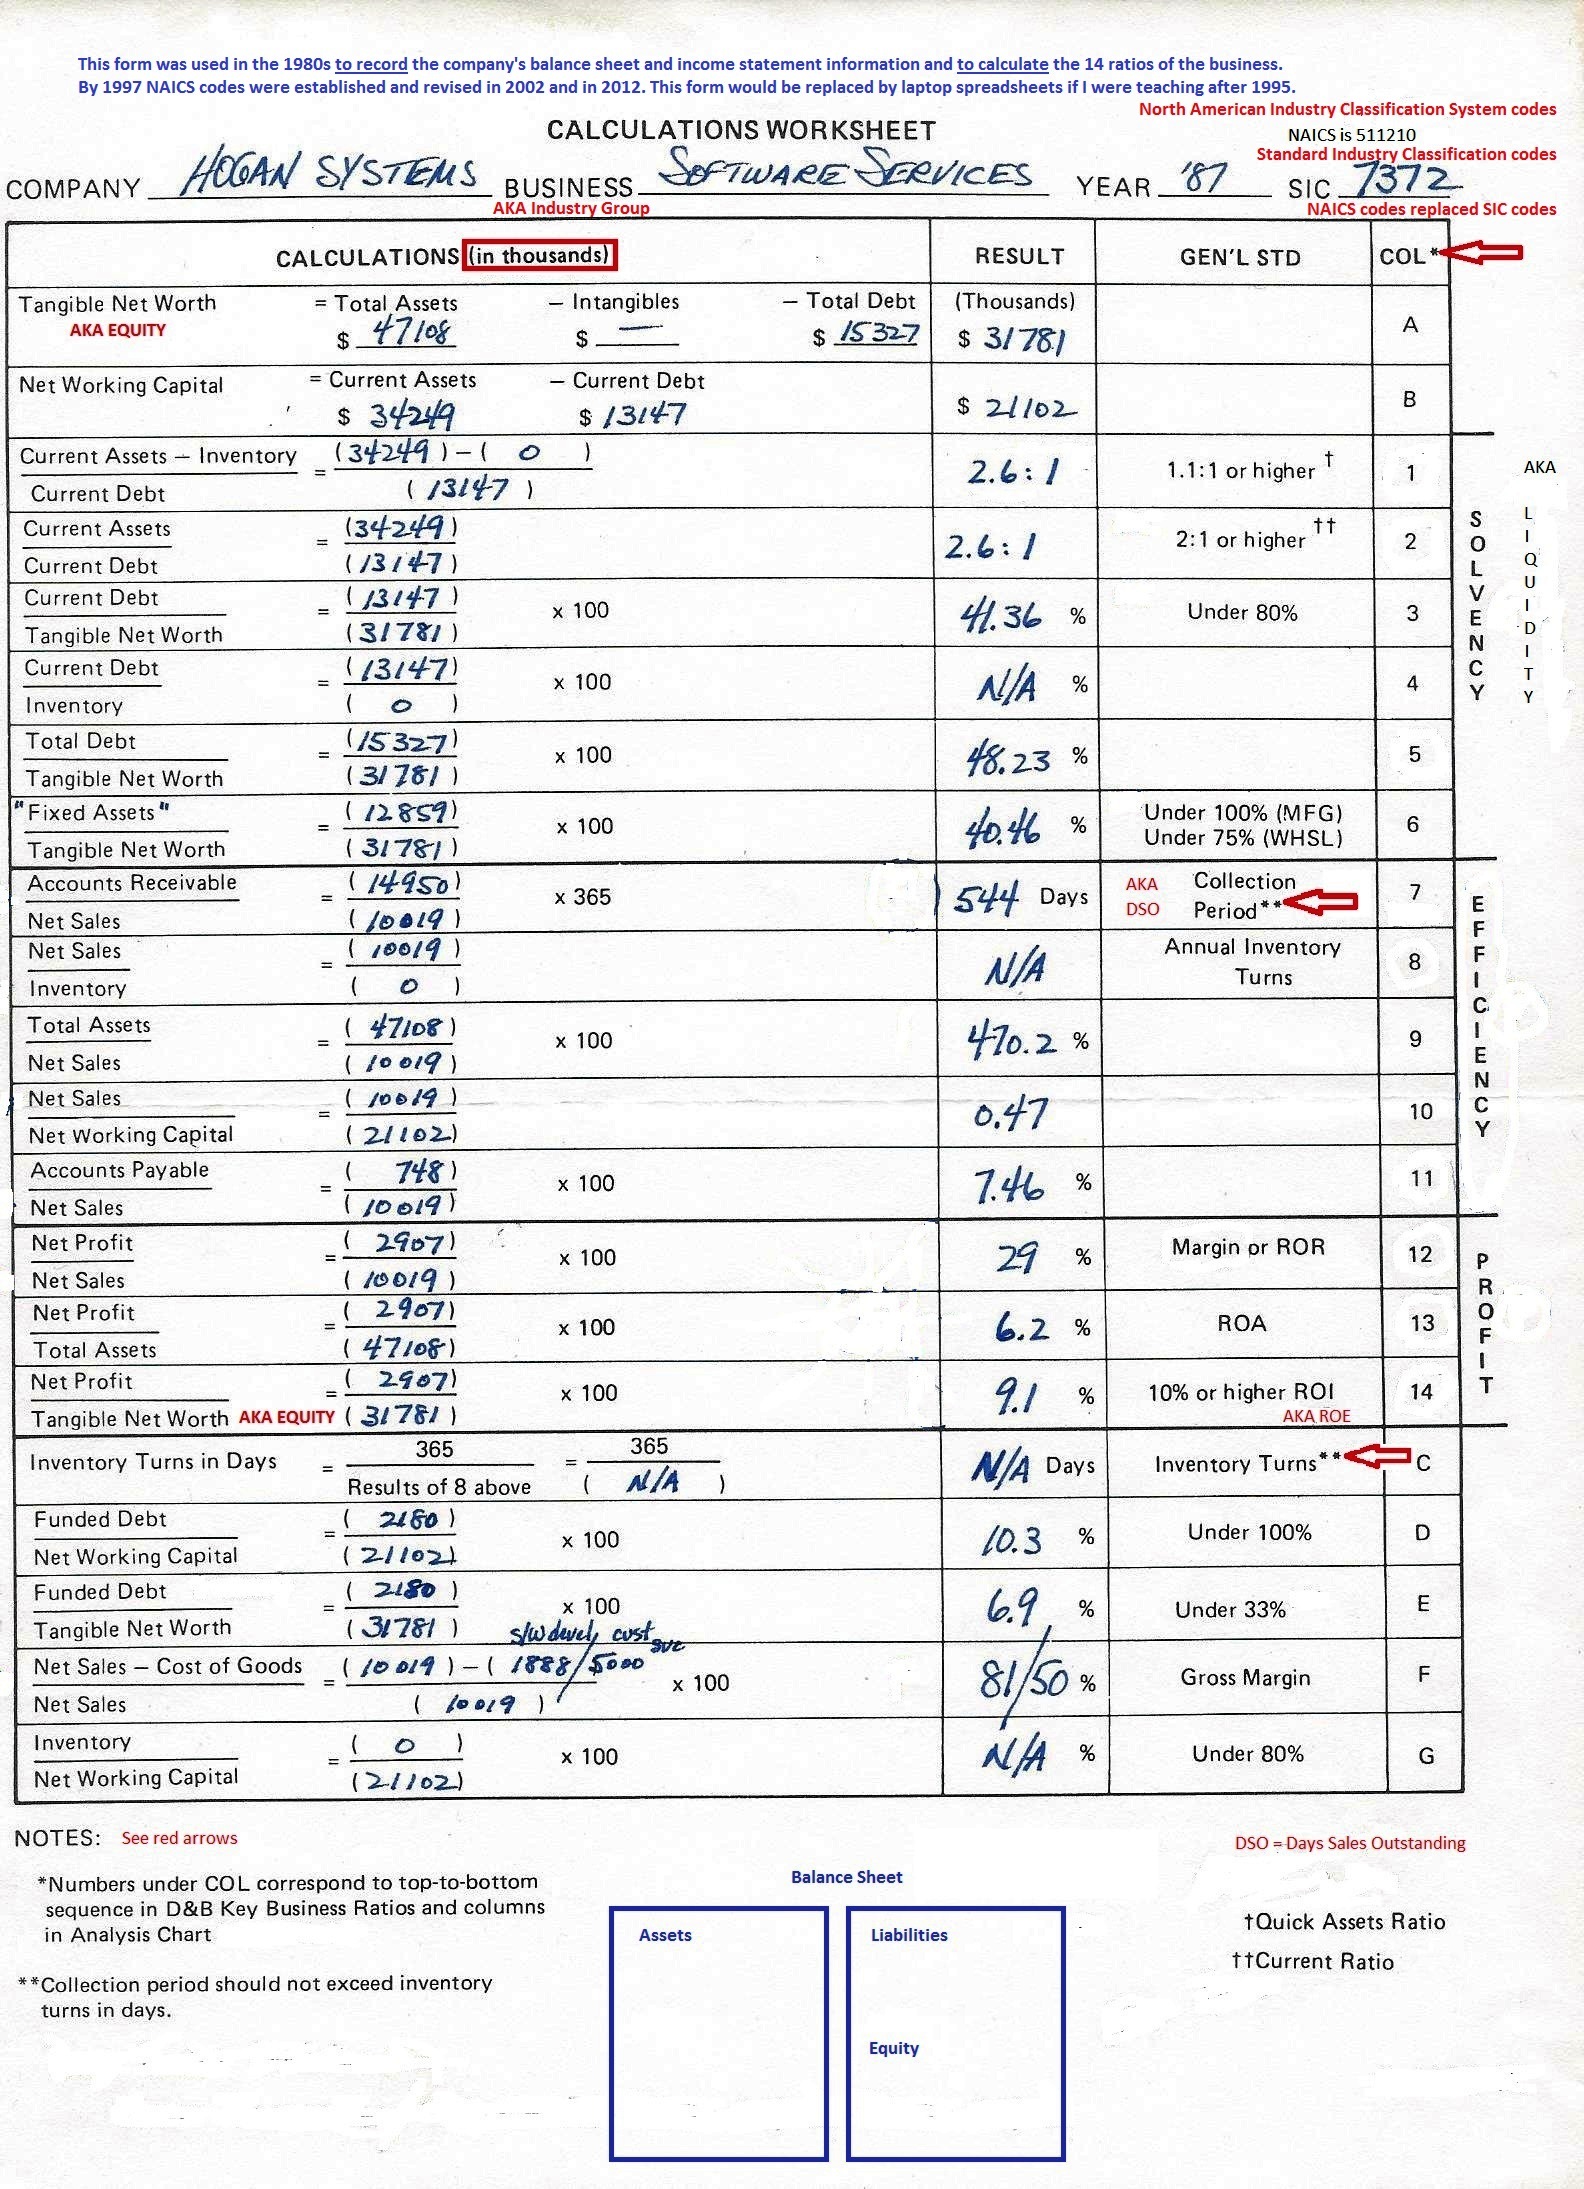
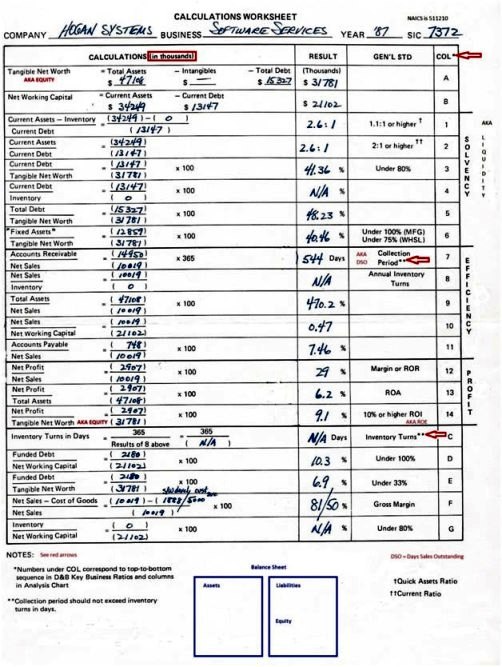
This analysis chart (with all of the arrows) was a visual aid used back in the 1980s. It was helpful to keep from getting buried in the numbers and see a “picture” of the executive’s company when compared to the industry norms. In 1992 the paper forms were replaced by computer screens with some calculations done by the program named Foxpower. Now (in 2015) this type of analysis is easily done with even newer electronic forms. There are websites that do this kind of analysis. Today we would teach the course with much different visual aids.